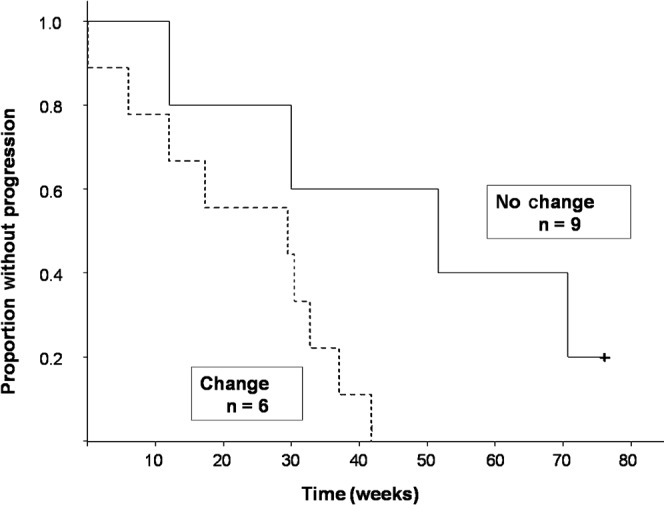
Figure 3.

Kaplan–Meier survival curve. Patients with a change in apparent diffusion coefficient (ADC) within regions of interest defined by fluid attenuation inversion recovery signal abnormality after treatment had significantly decreased progression-free survival compared with those with no change in ADC (p=0.046).
