
Figure 1.
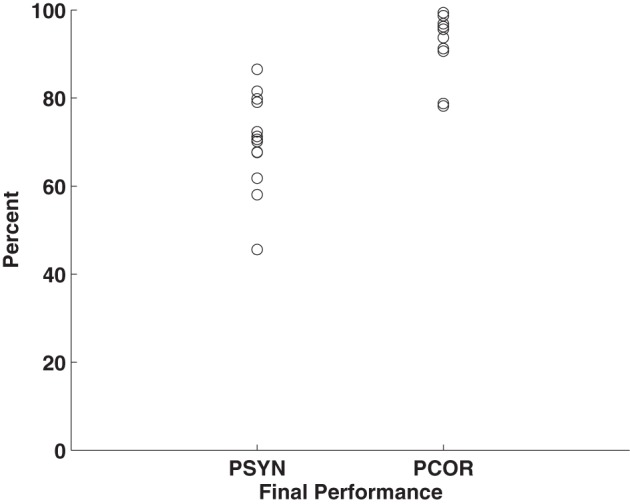
Plot of individuals' final performance on PCOR and PSYN. Points represent individual mean scores for the final run of Day 5.
Official websites use .gov
A
.gov website belongs to an official
government organization in the United States.
Secure .gov websites use HTTPS
A lock (
) or https:// means you've safely
connected to the .gov website. Share sensitive
information only on official, secure websites.
Plot of individuals' final performance on PCOR and PSYN. Points represent individual mean scores for the final run of Day 5.