
Figure 5.
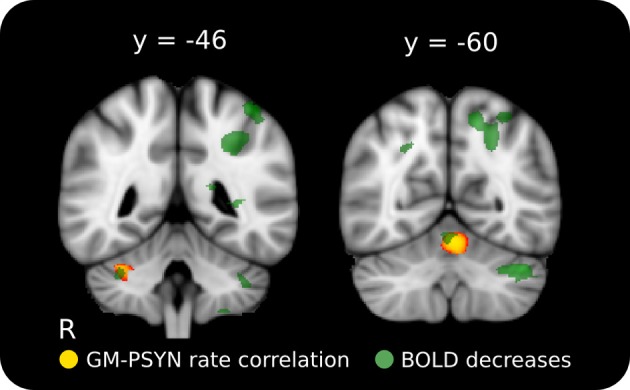
Positive relationship between rate of improvement on synchronization and GM volume in cerebellar lobules HVI and V. The cerebellar structures identified here correspond well with two regions where BOLD activity decreased across learning on this task. Red-Yellow: significant correlation between GM volume and rate of improvement (p < 0.05, corrected for multiple comparisons); Semi-Transparent Green: task-specific decrease in BOLD activity between Day 2 and Day 5 (p < 0.001, cluster corrected). Significant regions are overlaid on the ICBM 152 T1 average for display.