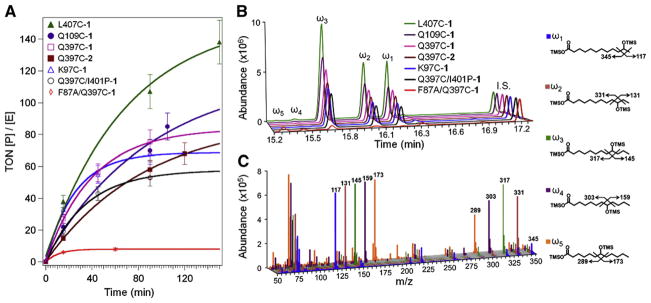
Fig. 3.
(A) Progress curves for the series of hybrid enzymes in the light-activated hydroxylation of lauric acid, displaying turnover numbers (concentration of product/enzyme concentration) vs. time. Representative chromatograms (B) and mass spectrometry fragmentation patterns (C) for the trimethylsilylated (TMS) derivatives of the hydroxylated products (ω1, ω2, ω3, ω4, ω5) are shown with their respective structures. 12-Hydroxydodecanoic acid was used as internal standard (I.S., 10 nmol).

