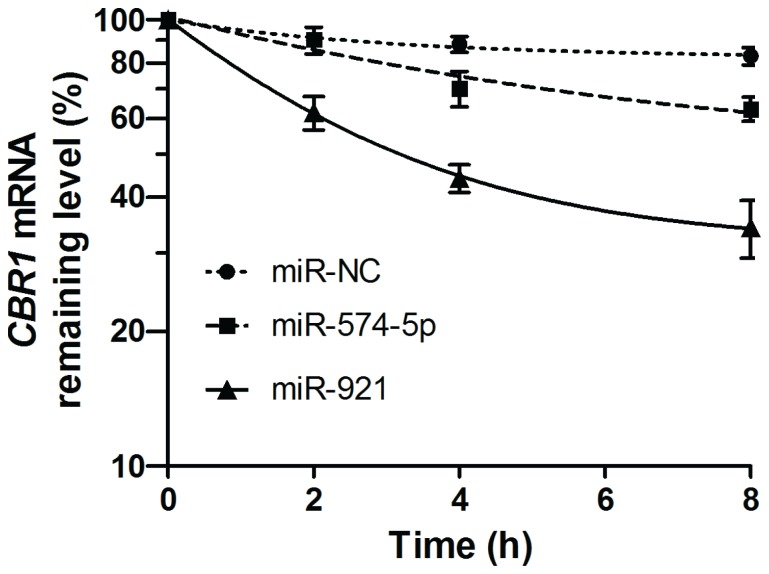
Figure 5. CBR1 RNA degradation.
Relative CBR1 mRNA levels were determined with a comparative quantitation method in cells transfected with miRNA negative control (hsa-miR-NC), hsa-miR-574-5p, or hsa-miR-921. Individual β-actin mRNA levels were used as normalizers. Results shown are mean±SD from triplicate exposures.

