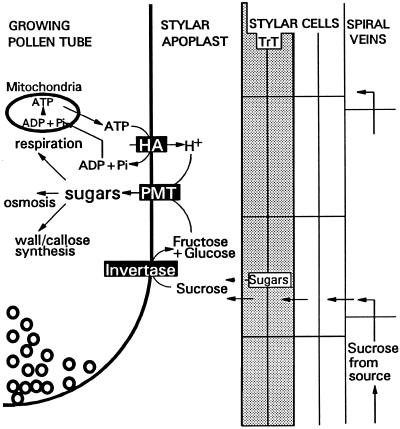
Figure 6.
Schematic representation of a model for carbohydrate loading of pollen tubes growing through the transmitting tract, with PMT1, H+-ATPase (HA), and wall-bound invertase (inverse highlighted). Left to right, One-half of a tip of a growing pollen tube, the stylar apoplast with transmitting tract cells (TrT, shaded), flanked by nongreen stylar cells with phloem cells (spiral veins). “Sugars” in the TrT cells represent additional sugars synthesized and eventually exported (dotted arrow) from green stylar cells. “Sugars” in the pollen tube represent carbohydrates after transport as monosaccharides over the membrane by PMT1. Small circles at the tube apex represent membrane vesicles and exocytosis (Derksen et al., 1995).

