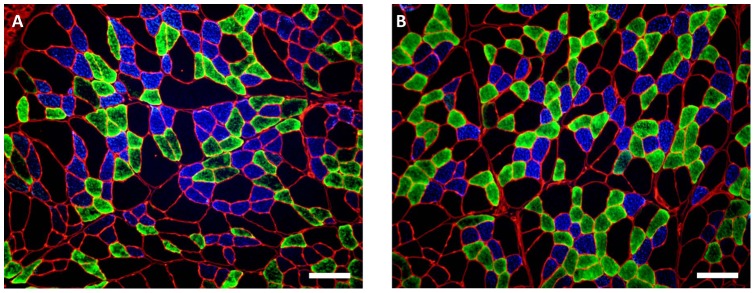
Figure 3. Immunofluorescent analysis of myosin heavy chain in the medial costal diaphragm.
(A) Diaphragm from ITTO animal. (B) Diaphragm from SHAM animal. Type I fibers fluoresced blue, type IIa illuminated green, and type IIx/b fibers remained free of fluorescence. Images were captured with 100X magnification. Scale bar represents 100 µm.

