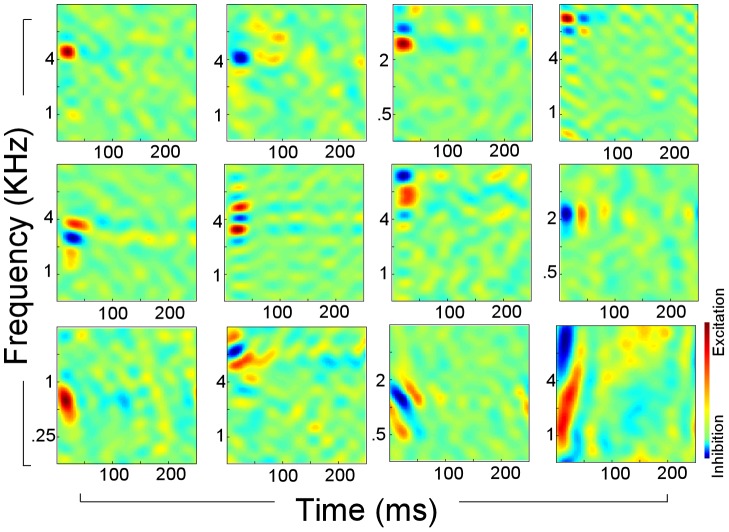
Figure 1. Neurophysiological receptive fields.
Each panel shows the receptive field of 1 neuron with red indicating excitatory (preferred) responses, and blue indicating inhibitory (suppressed) responses. Examples vary from narrowly tuned neurons (top row) to broadly tuned ones (middle and bottom row). They also highlight variability in temporal dynamics and orientation (upward or downward sweeps).

