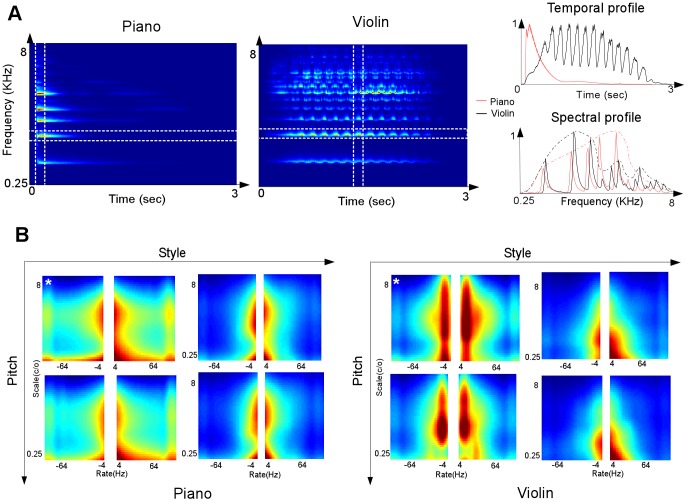
Figure 3. Spectro-temporal modulation profiles highlighting timbre differences between piano and violin notes.
(A) The plot shows the time-frequency auditory spectrogram of piano and violin notes. The temporal and spectral slices shown on the right are marked. (B) The plots show magnitude cortical responses of four piano notes (left panels), played in normal (left) and Staccato (right) at F4 (top) and F#4 (bottom); and four violin notes (right panels), played in normal (left) and Pizzicatto (right) also at pitch F4(top) and F#4 (bottom). The white asterisks (upper leftmost notes in each quadruplet) indicate the notes shown in part (A) of this figure.

