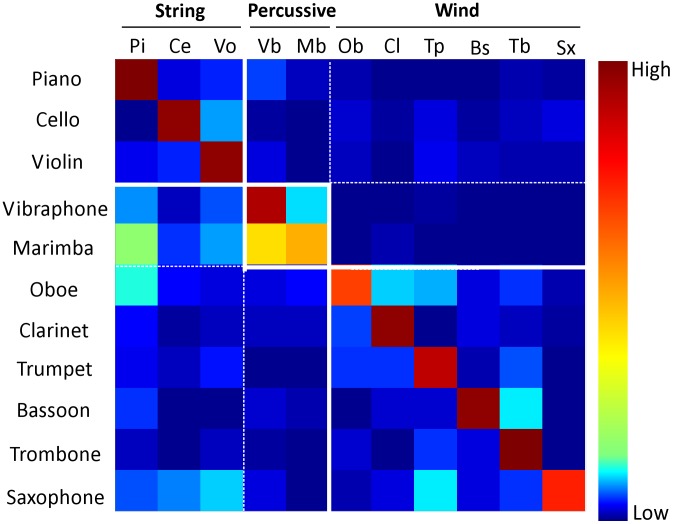
Figure 4. The confusion matrix for instrument classification using the auditory spectrum.
Each row sums to 100% classification (with red representing high values and blue low values). Rows represent instruments to be identified and columns are instrument classes. Off diagonal values that are non-dark blue represent errors in classification. The overall accuracy from this confusion matrix is 79.1%±0.7.

