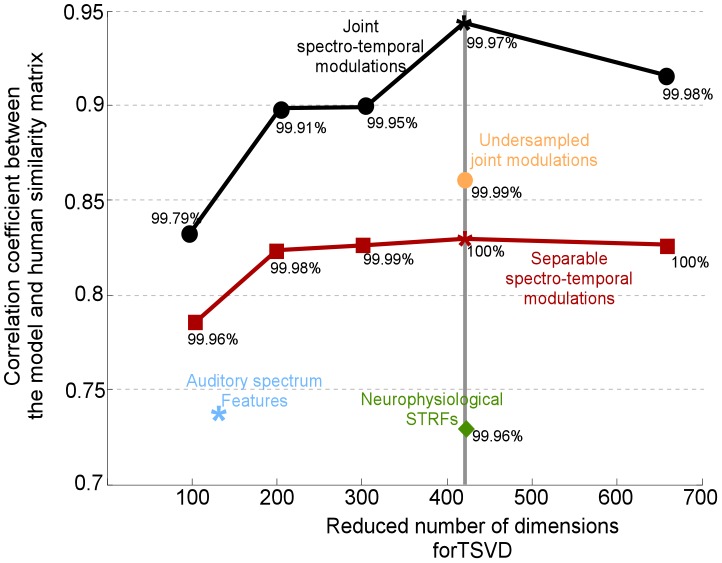
Figure 8. Correlation between human and model similarity matrices as a function of reduced feature dimensionality.
In each simulation, a cortical representation is projected onto a lower dimensional space before passing it onto the SVM classifier. Each projection maintains a given percentage of the variability in the original data (shown adjacent to each correlation data point). We contrast performance using full cortical model (black curve) vs. separable spectro-temporal modulation model (red curve). The empirical optimal performance is achieved around 420 dimensions; which are the parameters reported in the main text in table 2.

