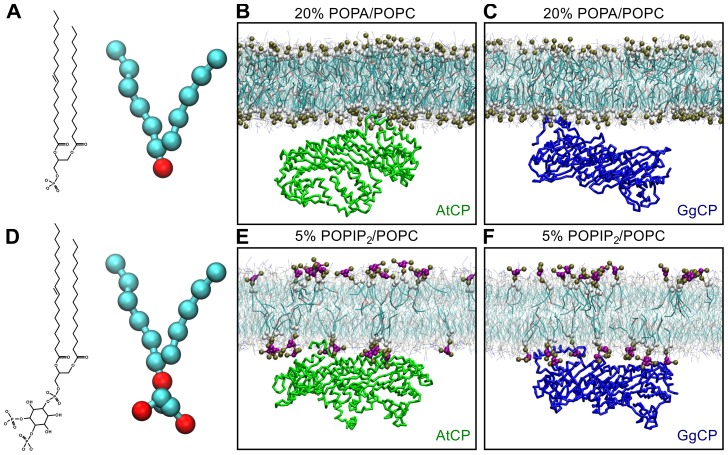
Figure 4. Comparison of interaction of AtCP and GgCP with distinct membranes at 500 ns.
Chemical diagrams and CG representations of A POPA and D POPIP2. The final state of the MD system containing B AtCP – 20% POPA (charge −2)/POPC, C GgCP – 20% POPA (charge −2)/POPC, E AtCP – 5% POPIP2/POPC and F GgCP – 5% POPIP2/POPC. CG water molecules and Na+ ions are not shown for the sake of clarity. Headgroups and glycerol backbone atoms of POPIP2 and POPA are highlighted in van der Waals representation. AtCP is colored green and GgCP is blue; only backbone atoms are shown in licorice representation. This figure was prepared with VMD [54].

