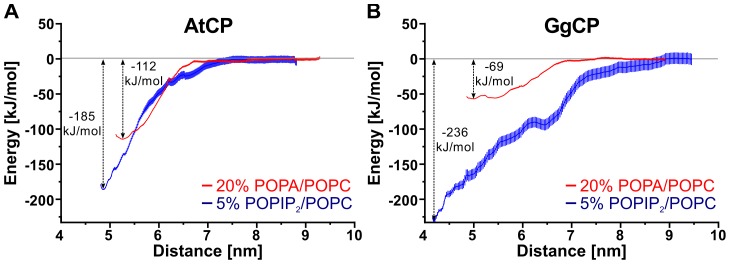
Figure 7. Potential of mean force (PMF) curves for pulling AtCP (A) and GgCP (B) from distinct membranes.
Red lines represent PMF curves for pulling respective protein from membranes containing 20% POPA/POPC. Blue lines represent PMF curves for pulling respective protein from membranes containing 5% POPIP2/POPC. Vertical red and blue lines indicate error bars generated by the Bayesian boostrap method of g_wham program [55].

