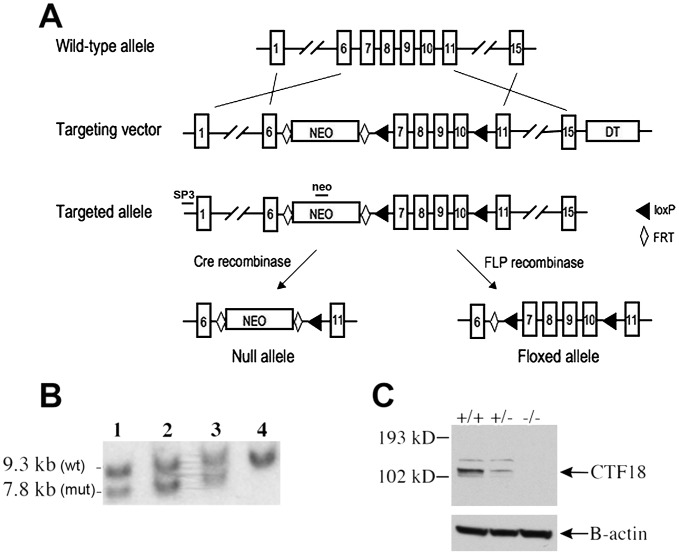
Figure 1. Derivation of Chtf18 −/− and Chtf18flox/flox mice.
(A) Gene targeting strategy (exons are not drawn to scale). LoxP sites are represented by triangles. Diamonds represent FRT sites. (B) Southern blot analysis of targeted ES cells (lanes 1, 2, and 3) and wild-type ES cells (lane 4). The probes used for Southern blot analysis are depicted as SP3 and neo. (C) Western blot analysis of testis protein extracts from Chtf18-null mice with CHTF18 antibody. A ß-actin specific antibody was used as a control.

