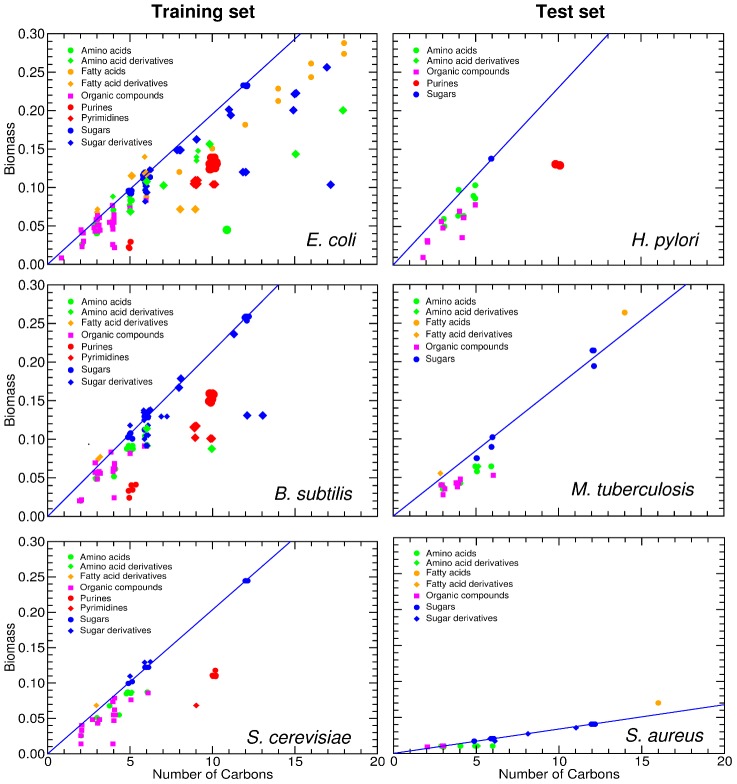
Figure 6. Biomass production is related to the number of carbons in a nutrient.
We show the optimized biomass production of each species on G nutrients, for species in the training set (left) and the test set (right). For all species there is a positive correlation between biomass production and the number of carbons in the nutrient. The blue line represents  (see text) for all the sugars uptaken by species s. S. aureus exhibits a reduced biomass production; the biomass defined in the in silico organisms demands approximately ten times more moles relative to the other species. In all the plots, the position of the nutrients on the X axis is slightly staggered so that all data points are visible. Note that the symbols for the complex nutrients are enlarged.

