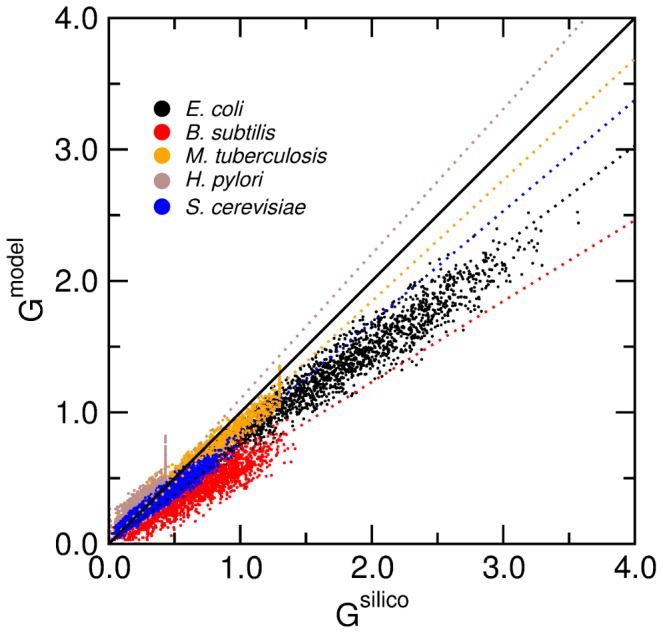
Figure 9. Validation of the model for biomass production on complex media.

We show, for 3000 randomly generated complex media containing sugars, fatty acids, bases, and amino acids (see Methods), the prediction for the biomass production as a function of the actual in silico growth. We show the results for E. coli, B. subtilis, S. cerevisiae, H. pylori, and M. tuberculosis. The dashed lines represent a regression of the predicted biomass production versus experimental in silico production . We obtain: K = 0.76 for E. coli, K = 0.62 for B. subtilis, K = 0.84 for S. cerevisiae, K = 1.10 for H. pylori, and K = 0.92 for M. tuberculosis.
