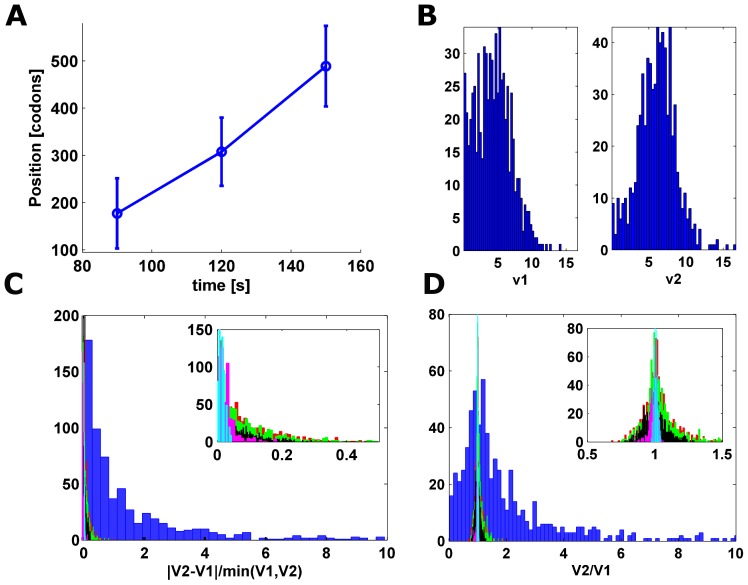
Figure 2. (A). Estimated position of the SL points (mean and standard deviation): = 4.3+/−2.6,
  = 6+/−2.5. v = 5.2+/−1.2 (Wilcoxon test: p = 2.2*10−26).
(B).  and
and  histograms. (C). Histogram of
  measure calculated on: 1) the experimental data (blue) (median value 0.82) 2) on simulated ribosomal densities of the analyzed isoforms for low/high/proportional initiation rates (green/red/black) and 3) ribosomal densities created using codons of equal translation efficiency for low/high initiation rates (magenta/teal). For the simulations, the obtained median values of the
  measures were 0.06/0.06/0.06/0.02/0.01, significantly lower than in the case of the experimental data (KS p-value <6.18*10−153 in all cases). The inset shows the ratio for the simulative data only. (D). Histogram of the
  ratio calculated on real and simulative data. The median value of this measure for the real ribosomal profiles was 1.37, significantly higher than for the simulative data, which resulted in median values of 1/1.01/1.01/1/1.01 accordantly (KS p-value <5.67*10−250 in all cases).

