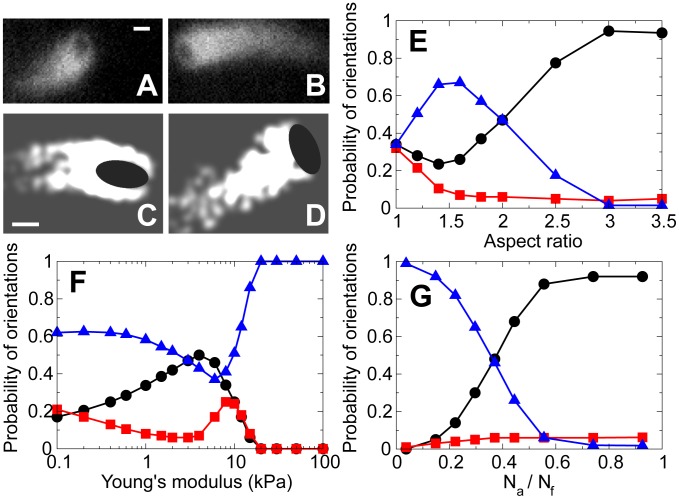
Figure 2. Motion of actin-propelled ellipsoidal beads.
(A–B) Fluorescent images show actin tails of the motile beads. The dark ellipsoidal shapes at the fronts of the tails illustrate bead's propulsion along its (A) long-axis and (B) short-axis. The detailed statistics of phase contrast images reported in [28] confirm that roughly halves of the beads move in each orientation. Bars:  . (C–D) Simulation snapshots of the same bead moving along its (C) long-axis and (D) short-axis at different time moments. Black circle: bead. White: actin networks with each node being a Gaussian-blurred dot of
  in decay width. Bars:
  . (E–G) Probability distribution of bead's orientation as a function of (E) bead's aspect ratio, (F) Young's modulus of actin networks, and (G) ratio of the numbers of attached and pushing filaments. Black circles: bead moves along the long-axis (
 ). Red squares: bead moves at a skewed orientation (
 ). Blue triangles: bead moves along the short-axis (
 ).
).

