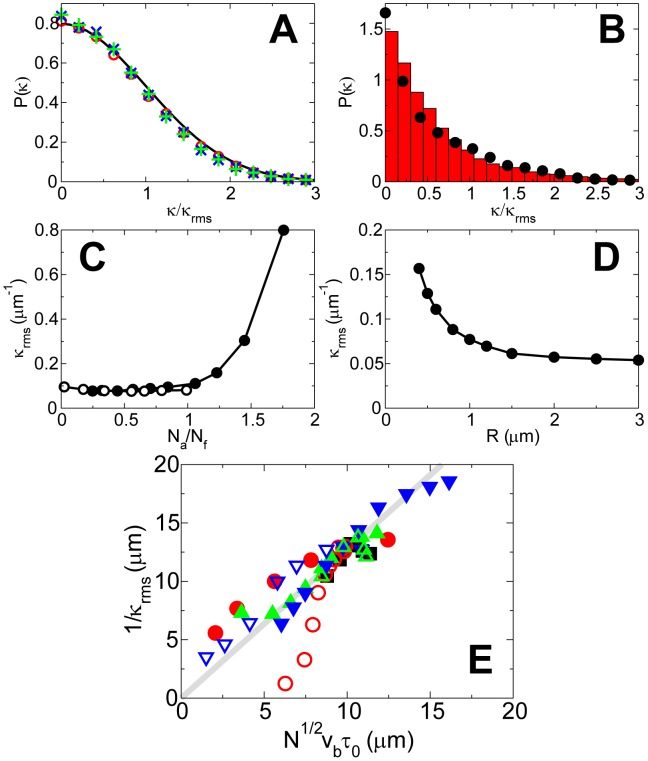
Figure 4. Trajectory curvature of actin-propelled spherical beads.
(A) Probability distribution of the normalized trajectory curvature for default values of parameters (open red circles), twice the value of attached to pushing filament ratio (green pluses) and twice the bead radius (dotted line), compared to a Gaussian distribution (solid black line). (B) Probability distribution of the normalized trajectory curvature with  (circles) compared with experimental results (bars). (C) Dependence of the root-mean-square curvature on the attached to pushing filament ratio varied by varying
  (open circles) and
  (solid circles). (D) Dependence of the root-mean-square curvature on the bead's radius. (E) Dependence of the inverse root-mean-square curvature on
  . Solid gray line: analytical prediction. Symbols: values of
  changed by varying
  (solid black square),
  (solid red circle),
  (open red circle),
  (solid green up-triangle),
  (open green up-triangle),
  (solid blue down-triangle) and
  (open blue down-triangle).

