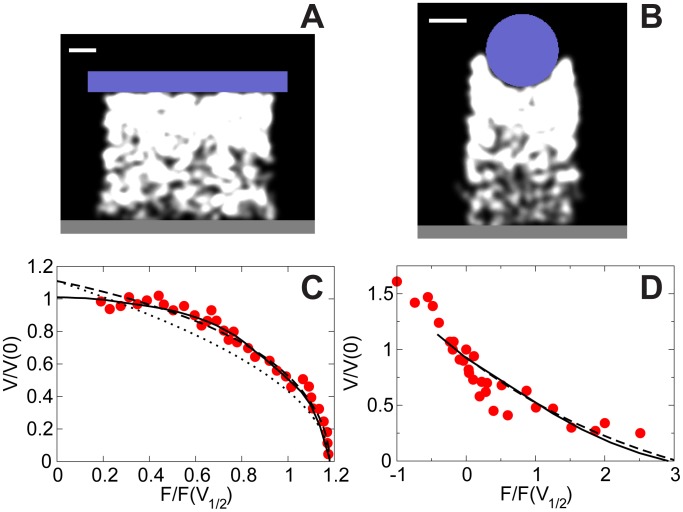
Figure 5. Simulated force-velocity relation of actin networks.
(A–B) Snapshots of hybrid model simulations. Blue: obstacles. White: actin networks. Dark gray: rigid substrate. Bars:  . (A) Actin network grows continuously against a flat cantilever with force being proportional to the deflection. (B) Actin network grows against a spherical bead, with force being clamped for each velocity measurement. (C–D) Simulated force-velocity relation compared with the data. (C) Computational results corresponding to the setup in (A). Red circles: experimental data from [19]. Solid line: hybrid model simulation. Dashed line: prediction of the 1D theory in Text S1. Dotted line: approximate analytical formula
  . (D) Computational results corresponding to the setup in (B). Red circles: experimental data from [18]. Solid line: hybrid model. Dashed line: prediction of the 1D theory in Text S1.

