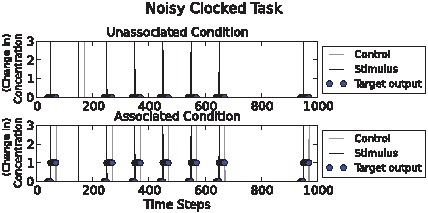
Figure 2. Noisy clocked task illustration.

Above: “unassociated” condition. Below: “associated” condition. Stimulus (“S”) pulses and control (“C”) pulses are shown as black and grey spikes respectively. Circles show target output chemical concentration values. Note that the second input event, at time t = 150, (in both conditions) is a noisy event, either a false positive or a false negative control chemical pulse occurs. The environments can be distinguished on the fact that in the associated condition below the pulses co-occur with greater frequency than in the unassociated condition.
