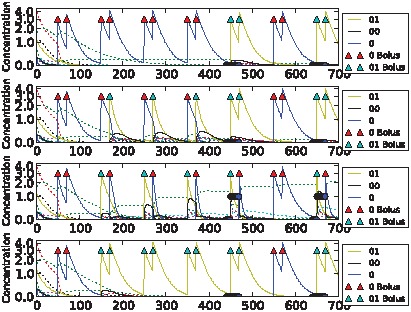
Figure 10. Sample dynamics of an evolved network for the 2-bit environment task.

From top to bottom: C→C, C→S, S→C and S→S environments. Black solid line shows output concentration; yellow solid line shows stimulus concentration; blue solid line shows control concentration. Dotted lines show intermediate chemical concentrations. Circles indicate target output values for the network. Triangles show input boluses.
