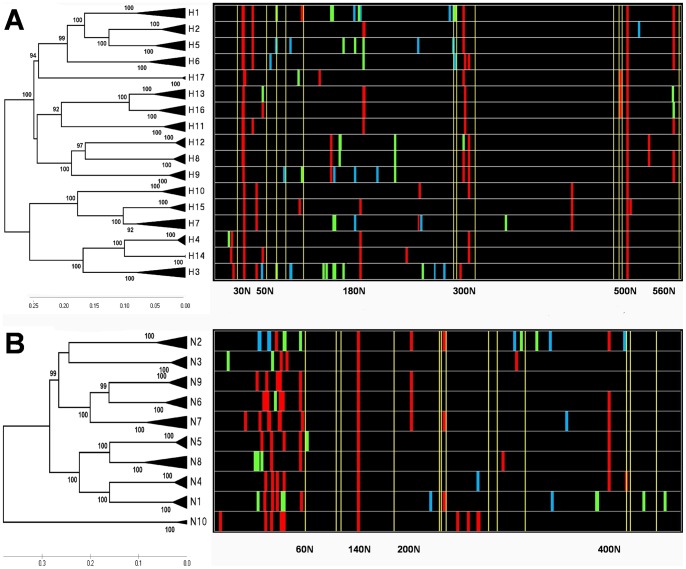
Figure 1. The N-J trees of two glycoproteins in IVs with the corresponding distribution chart of glycosites.
The phylogenetic trees of HAs and NAs were constructed using three to ten representative amino acid sequences in each subtype (File S1). The distribution charts of glycosites, colored according to the statistics of conservation in each HA or NA subtype (File S2), are shown in various strips. The red, green and blue color represent the levels of conservation of “>95%”, “5%∼95%” and “<5%”, respectively. The conserved cysteines are shown in yellow strips. (A) The N-J tree of HA subtypes with the corresponding distribution chart of glycosites. (B) The N-J tree of NA subtypes with the corresponding distribution chart of glycosites.

