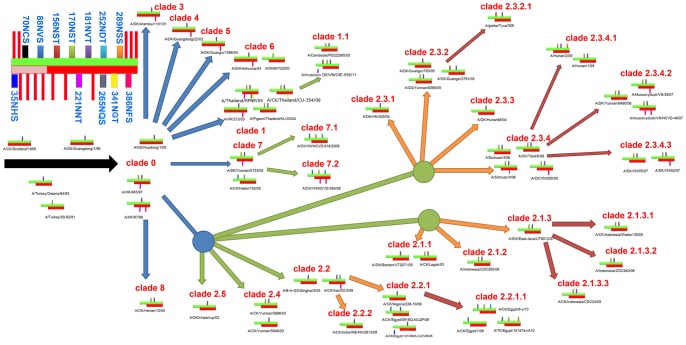
Figure 4. The co-evolution of glycosites between HA and NA in H5N1 virus.
A schematic of diverse glycosites in HA and NA is shown in the top left corner. The green and red crossbands represent HA and NA, respectively, and the lightly colored area in NA is the stem domain. The negligible and highly conserved glycosites are shown in the red strip, while the remainder are labeled in cyan text. All the first-, second-, third- and fourth-order clades are shown with blue, green, orange and crimson arrows, respectively.

