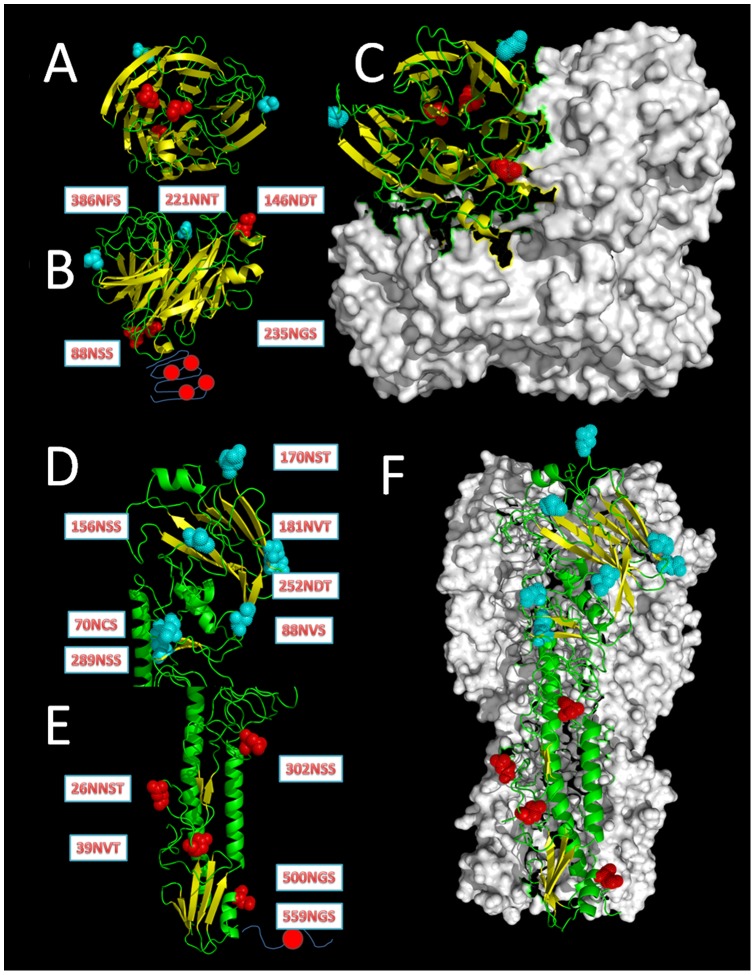
Figure 5. The full NAs and HAs structure and the distribution of glycosites.
Those most conserved glycosites (>95%) are shown in red spheres, while the remainder are shown in cyan spheres. (A) The bottom view of the global domain of the NA monomer. (B) The side view of a NA monomer, the deletion of the stem domain would decrease four Glycosites. (C) The top view of the NA tetramer. (D) The side view of the global domain in the HA monomer. (E) The side view of the stem domain in the HA monomer, the 559NGS glycosite in the fusion peptide domain cannot be seen due to limited data. (F) The side view of the HA trimer.

