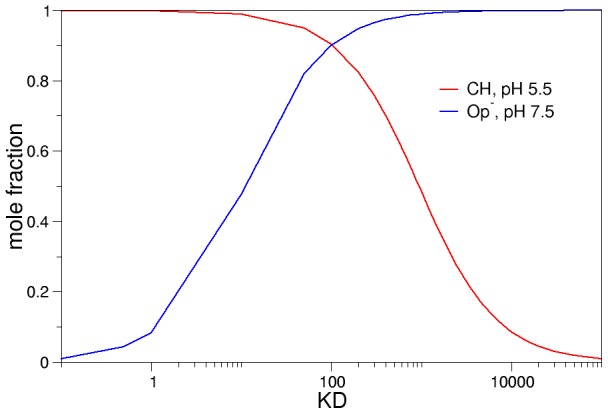
Figure 5. Concentration of CH at pH 5.5 and Op− at pH 7.5 as a function of KD.

(CH) at pH 5.5 shown in red, while (Op−) at pH 7.5 is shown in blue. The concentrations are given as mole fractions.

(CH) at pH 5.5 shown in red, while (Op−) at pH 7.5 is shown in blue. The concentrations are given as mole fractions.