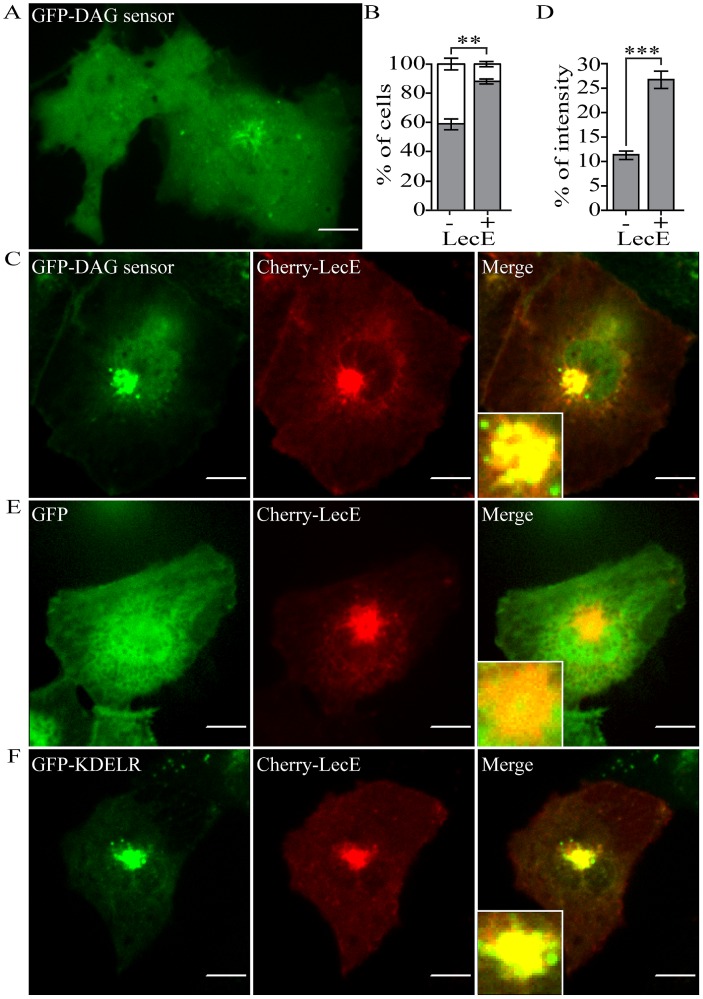
Figure 11. LecE alters the distribution of a GFP-DAG sensor in COS7 cells.
When expressed alone the GFP-DAG sensor (green) showed two localization patterns in COS7 cells (A, B), a diffuse pattern (left cell in panel A and white bar in panel B) and a pattern in which it was diffuse in the cell but was also concentrated in a membranal peripheral nucleus area (right cell in panel A and grey bar in panel B). These two patterns were also observed when the GFP-DAG sensor was expressed together with Cherry-LecE (red) (C). The percentage of cells (% of cells) that showed each pattern of the GFP-DAG sensor was determined in cells that expressed the GFP-DAG sensor by itself (−) or with Cherry-LecE (+). Three independent experiments were preformed and the number of cells which showed each of these patterns with and without Cherry-LecE was found to be significantly different (** - p<0.007, Student's t-test). (D) Quantification of the GFP-DAG sensor accumulation at the peripheral nucleus area of COS7 cells, presented as the ratio between the green fluorescence intensity in the peripheral nucleus area to the total cell intensity of the GFP signal (% of intensity), was preformed in cells that expressed the GFP-DAG sensor by itself (−) or with Cherry-LecE (+). The difference between cells with or without Cherry-LecE was found to be significantly different (2.35 fold, *** - p<1.2×10⁻¹⁰, Student's t-test). Cherry-LecE was also expressed in COS7 cells together with GFP as a negative control (E) or with the cis-Golgi marker GFP-KDEL-Receptor (GFP-KDELR) (F) to determine its localization. The images were acquired using confocal microscopy as described in the Materials and Methods section. The scale bar = 10 µm.

