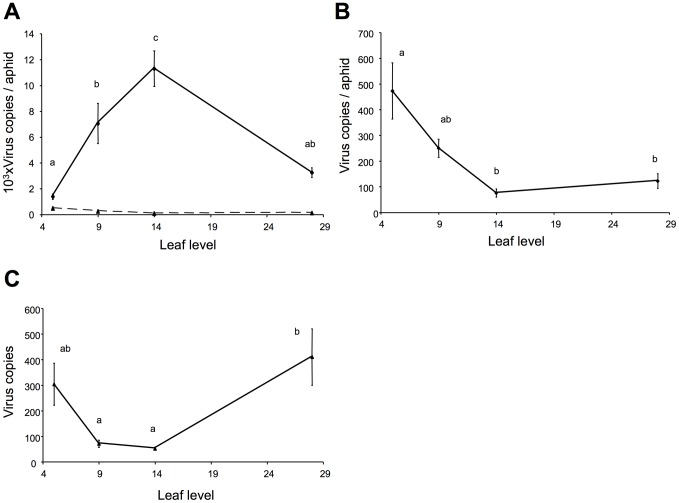
Figure 1. Dynamics of CaMV load in phloem sap.
(A) Comparison of the mean virus load in aphids fed for 10 minutes (dashed line, see also B) and 16 hours (solid line) on the leaf levels indicated (vertical bars indicate standard error). The experiment was conducted in parallel on 20 plants. The difference between the two treatments was highly significant (linear mixed-effects model with leaf level and treatment as fixed effects and plant as random effect; p-value <0.001). Significant differences were also found among viral sap loads in successive leaf levels when aphids were fed for 16 hours (Tukey's HSD, different letters mean p-values <0.02). Results from aphids fed for 10 min. are further considered in B. (B) This panel shows the same data as in (A), for viral sap load in aphids fed for 10 minutes, but the scale of the y-axis enlarged 20 times (Tukey's HSD, different letters mean p-values <0.001). (C) Virus concentration in plant cells of the same leaf and leaf levels as in (A) and (B), expressed as normalized mean virus copies per actin gene copy. Although significant differences are observed among certain leaf levels, the average cellular virus load appears relatively constant, the range falling within the same order of magnitude (Tukey's HSD, different letters mean p-values <0.03).

