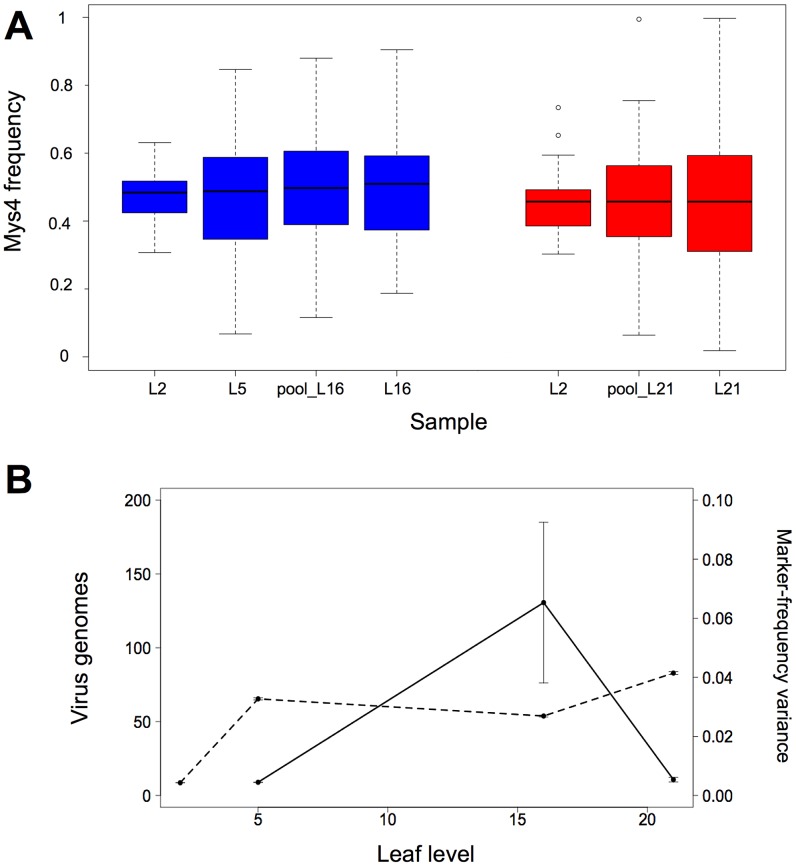
Figure 2. Bottleneck sizes at CaMV entry into different leaf levels.
(A) Boxplot of the Mys4 frequency distributions in samples harvested successively in two sets of 50 replicate plants. In the first set of plants (blue), harvested samples were leaf level 2 (L2), leaf level 5 (L5), pooled leaves below leaf level 16 (pool_L16), and leaf level 16 (L16). In the second set of plants (red), harvested samples were leaf level 2 (L2), pooled leaves below leaf level 21 (pool_L21), and leaf level 21 (L21). The average frequency of Mys4 did not vary during CaMV progression into host plants, demonstrating the equi-competitiveness of Mys4 and Mys7 (linear mixed-effects model with leaf level as a fixed effect and plant as a random effect: p-values = 0.450/0.818, and the slope of the two linear regressions of Mys4 frequency over time is not significantly different from 0: p-values = 0.124/0.616). (B) The full line shows changes in the average number of CaMV genomes founding the population in successive leaf levels. The number of viral genome founders (CI95%) in leaf levels 5, 16 and 21 was: 8.8 (6.4–14.1), 124.7 (19.1–908.9) and 10.8 (7.1–23.9), respectively. The dashed line represents changes in the variance of Mys4 frequency among repeated plants at successive leaf levels (scale on the right). Confidence limits for variance values were obtained using a resampling technique (1000 bootstraps sampling 50 frequency values with replacement). Error bars represent standard errors.

