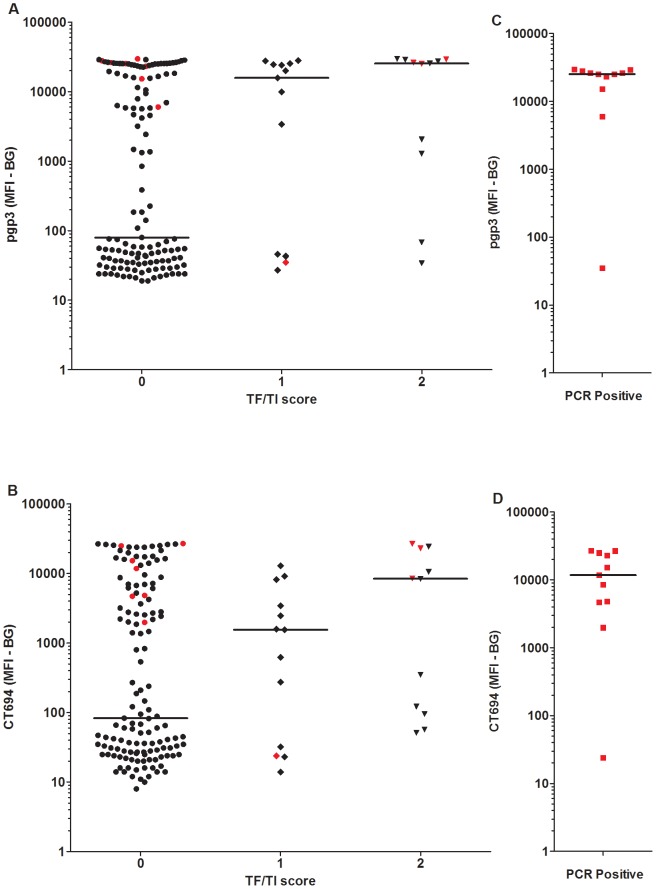
Figure 3. Antibody response by clinical diagnosis and PCR.
Median responses are shown in median fluorescence intensity minus background (MFI-BG) for antibody response to (A) pgp3 and (B) CT694 in relation to clinical diagnosis. Antibody response to (C) pgp3 and (D) CT694 is shown by PCR positivity. Responses shown in red indicate PCR positivity. Antibody responses to pgp3 differed between children with no clinical signs and PCR positive children (p = 0.0008) and between children with no clinical signs and those with a TF/TI score of 2 (p = 0.0041). For CT694, antibody responses for children with no clinical signs were lower than for PCR positive children (p = 0.0024) and for those with a TF/TI score of 2 (p = 0.0282).

