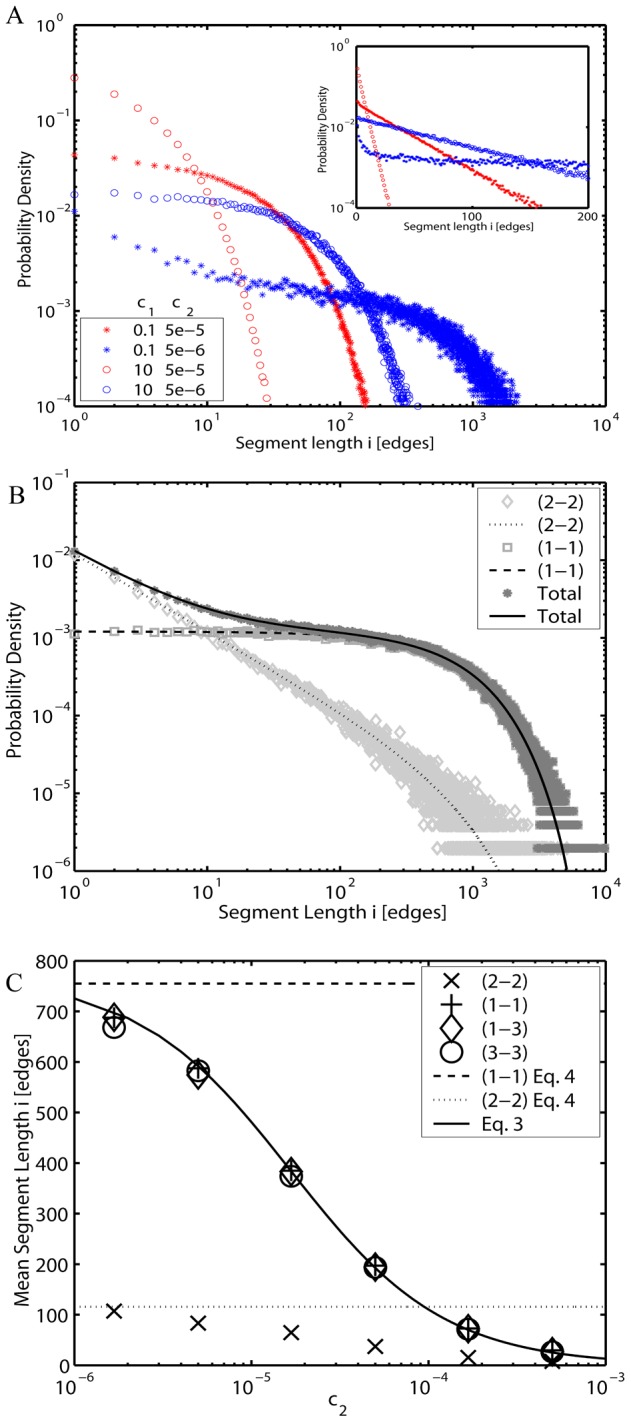
Figure 3. Chondriome segment lengths (L = 3·104).

(A) Examples of segment length distributions for different values of tip-to-tip and tip-to-side fusion/fission rates c
1 and c
2 respectively (stars: c
1 = 0.1; open circles: c
1 = 10; red color: c
2 = 5.0·10−5; blue color: c
2 = 5.0·10−6) in the agent-based representation. The same data plotted using semi-log scaling (inset) highlight deviations from the geometrical decay in short segments due to influence of loop structures. (B) Distributions for loops (light gray diamond), open segments (gray square) and total (dark gray star) for the simplified network (c
2 = 0) as calculated by the stochastic algorithm, compared to the exact analytical results: Dotted and dashed lines are contributions from loops and open segments, respectively, according to Eq. 5 (after normalization). (C) Markers - mean values differentiated by segment types as determined by the agent-based simulations: (1-1) - plus; (1-3) - diamond; (2-2) - cross; (3-3) - circle. Solid line:  from the deterministic model. Dotted and dashed lines: Limiting values at c
2 = 0 (Eq. 5) for sizes of loops (2-2) and open-ended (1-1) segments respectively.
