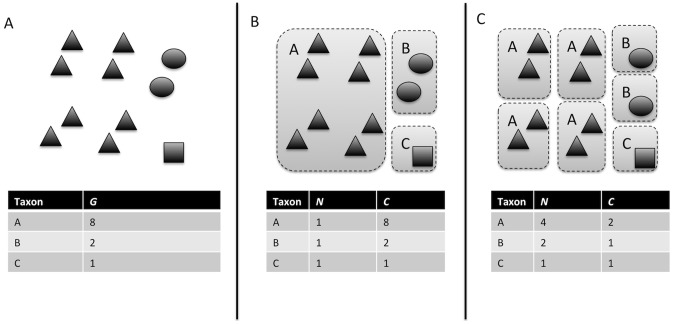
Figure 1. Conceptual diagram illustrating how variation in genomic 16S copy number could influence observed abundance of 16S gene sequences in a community.
Observed 16S gene sequence abundances (G) in an environmental sequencing data set (A) could be generated by a variety of underlying organismal abundance distributions (N; e.g. B or C) depending on the genomic copy number of the 16S gene (C) within individual cells of the organisms in the community (gray rectangles denote single cells, black symbols denote copies of the 16S gene from different organisms).

