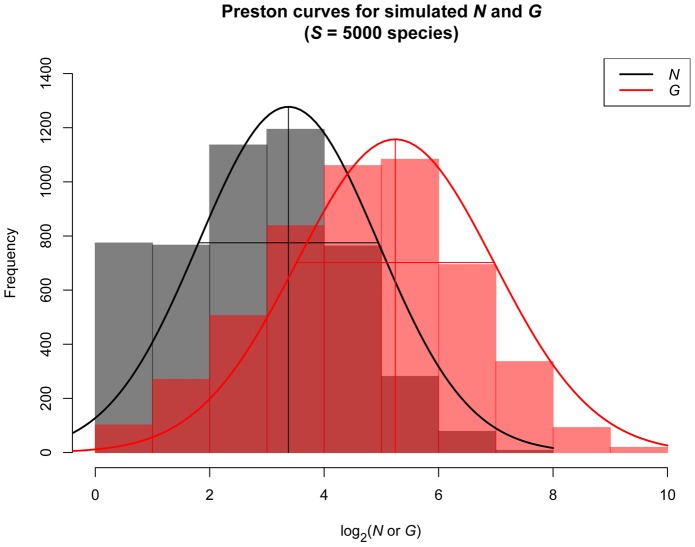
Figure 3. Taxa-abundance and taxa-gene curves (number of species in log2-abundance octaves) fit to a simulated distribution of organismal abundances (Ni; black) and resulting gene abundances (Gi; red) for 5000 species.
For each species, abundance P(N) was simulated as a zero-truncated lognormal distribution (mean = 2, variance = 4), copy number P(C) was simulated as a zero-truncated Poisson distribution (mean = 4, variance = 4), and P(G) was calculated as P(G) = P(N)P(C) following Equation 3.

