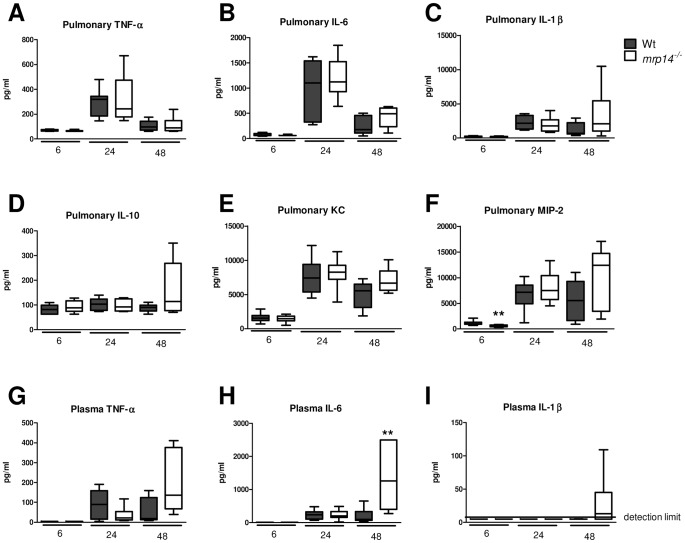
Figure 5. Cytokine and chemokine levels in lungs and plasma.
Lung cytokine (TNF-α, L-1β, IL-6, IL-10) (A–D), chemokine (KC and MIP-2) (E–F) and plasma cytokine (TNF-α, L-1β, IL-6 ) levels (G–I), 6, 24 and 48 hours after intranasal K. pneumoniae infection in Wt (grey) and mrp14−/− mice (white). Data are expressed as box-and-whisker diagrams depicting the smallest observation, lower quartile, median, upper quartile and largest observation (8 mice per group at each time point). * p<0.05, ** p<0.01 versus Wt mice.

