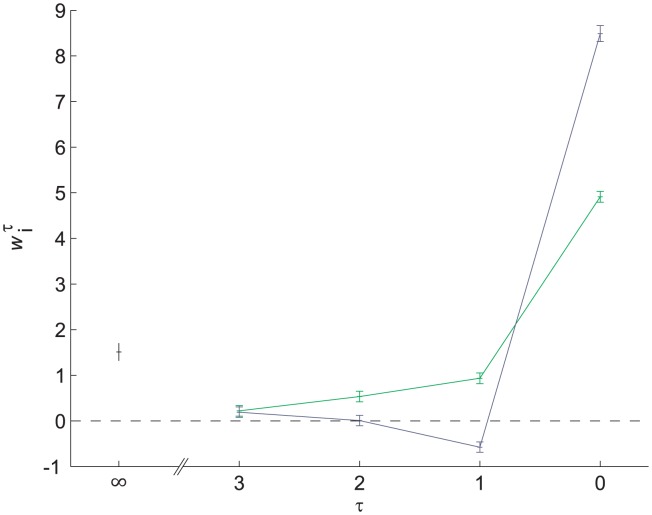
Figure 3. Recency effect.
To estimate the effect of stimuli administered in previous trials on decision in a trial, we fitted a linear non-linear model that relates the outcome of each trial to a linear combination of present and past stimuli (Eq. 1). The parameters that minimize the square error between the prediction of the model and participants' responses are presented. Green -  , Dark blue -
  , Black -
  . Error bars are 68% confidence intervals (equivalent to one standard deviation in a normal distribution) and we assumed that
  , which means that the model had 9 free parameters (
 and
and  ), and was fitted using 16,380 trials (65 trials in 252 blocks).

