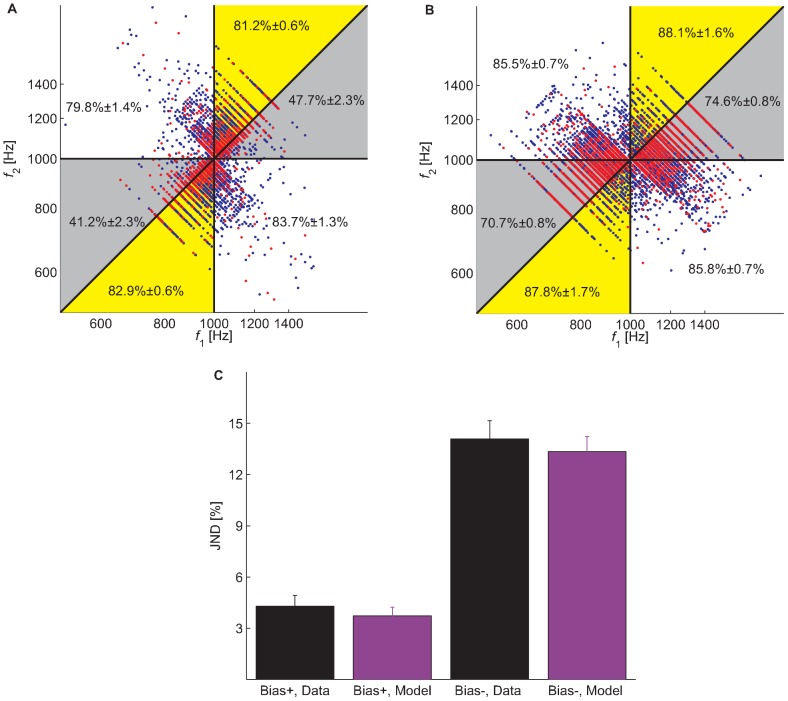
Figure 5. Results of Experiment 2.
A, Pattern of responses in the Bias+ condition, in which the fraction of trials in the Bias+ region (yellow) is larger than the fraction of trials in the Bias− region (gray). B, Pattern of responses in the Bias− condition, which oversamples the Bias− region. Same presentation as in Fig. 2A . C, Experimental (black) and Implicit Memory Model simulation (purple) Mean ± SEM JND in the Bias+ (left) and Bias− (right) conditions. In the simulations, the parameters of each block were estimated in the Bias+ condition and were used to simulate the implicit memory model in both the Bias+ and in the Bias− conditions.

