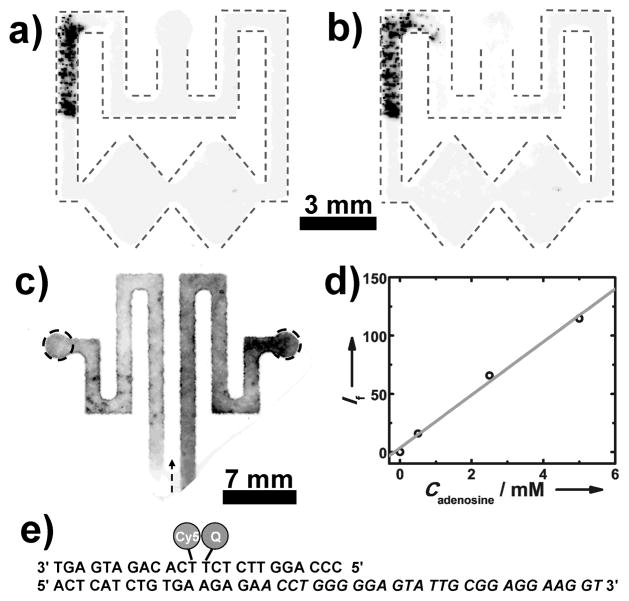
Figure 2.
(Top row) Fluorescent images of the oPAD showing 10 μm fluorescent microbeads preloaded in one split channel a) before and b) after the introduction of 0.01 M PBS buffer (pH 7.4) at the inlet. For clarity, the channels are outlined using dash lines. c) A fluorescence image of a paper fluidic device having two channels preloaded with 15 μL of a solution containing 0.32 μM adenosine aptamer strand, 0.20 μM fluorophore strand, and 0.40 μM quencher strand. The right channel was filled with 15 μL of 0.01 M PBS buffer (pH 7.4)
containing 5 mM adenosine, and the left channel was filled with 15 μL of adenosine-free PBS. The arrow shows the flow direction. The darker color in the right channel represents enhanced fluorescence due to the presence of adenosine. d) A plot of fluorescent intensity (If) versus the concentration of adenosine (Cadenosine) in the sample. The intensity was measured in the right circle shown in c) and subtracted from the intensity measured in the left circle. e) Sequences of aptamer strand, the fluorophore strand, and the quencher strand. The sequence for binding to adenosine is in italics.

