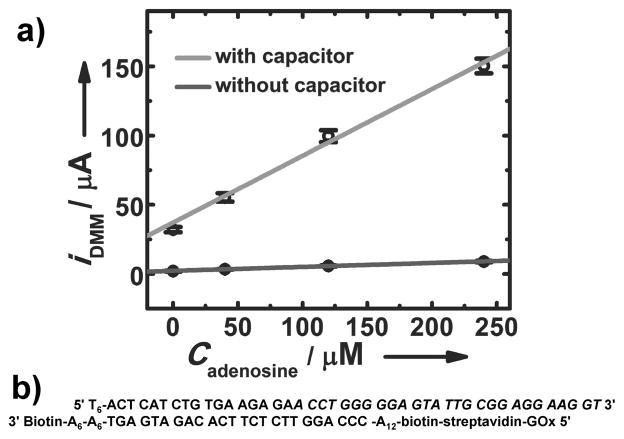
Figure 3.
a) Calibration curve for detecting adenosine using the oPAD with and without amplification by a capacitor. The error bars represent standard deviation of readings from a DMM for three measurements. b) Sequences of DNA strands of the aptamer sensor. The sequence for binding to adenosine is in italics.

