
Table 7.
Multiple risk factors-adjusted ORs and 95% CIs in the relationship between neuropathy and stimulated C-peptide level
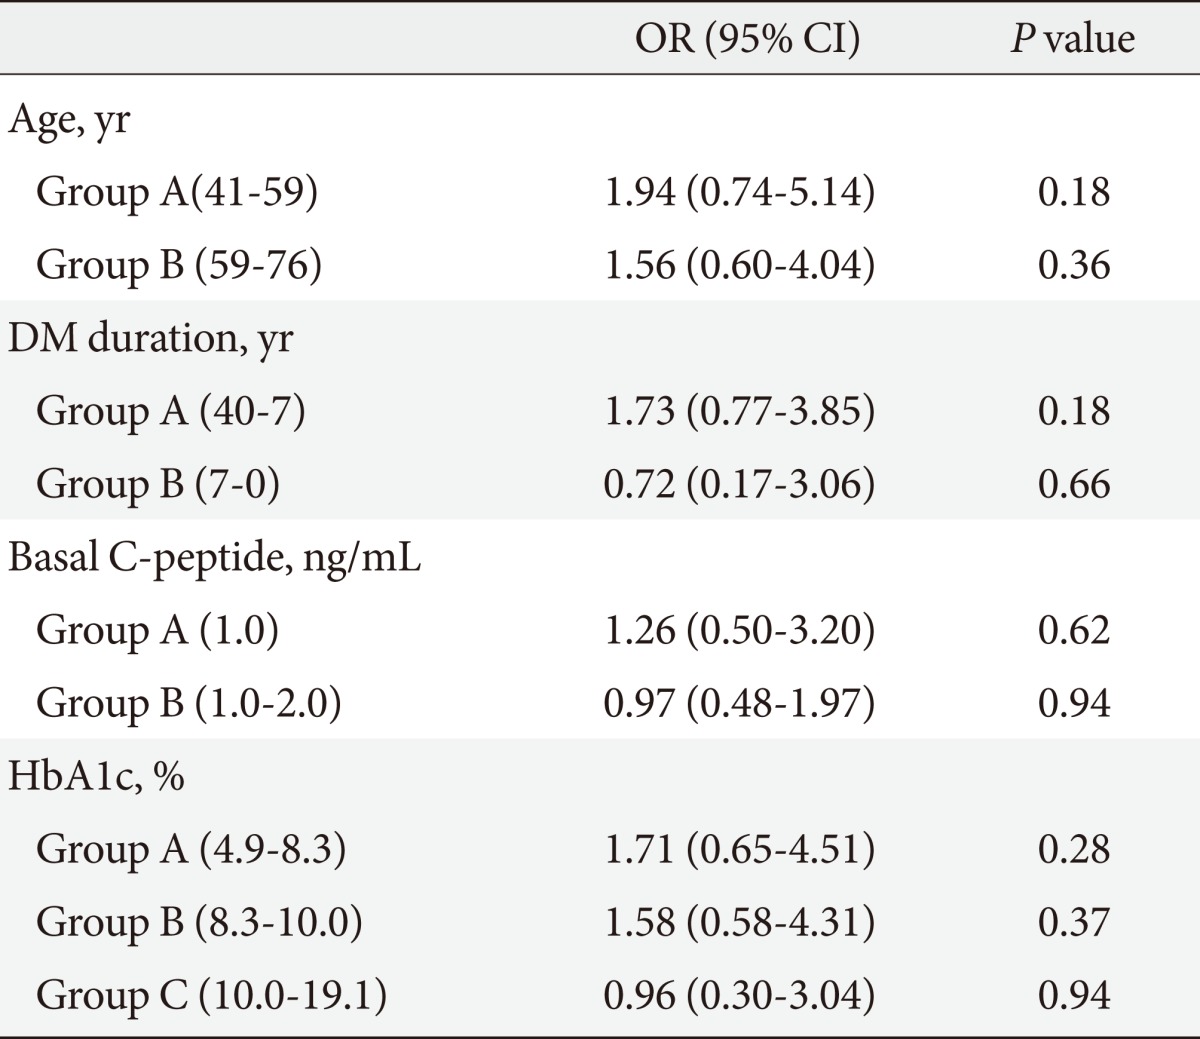
Groups A and B are composed of serial data.
OR, odds ratio; CI, confidence interval; DM, diabetes mellitus; HbA1c, hemoglobin A1c.