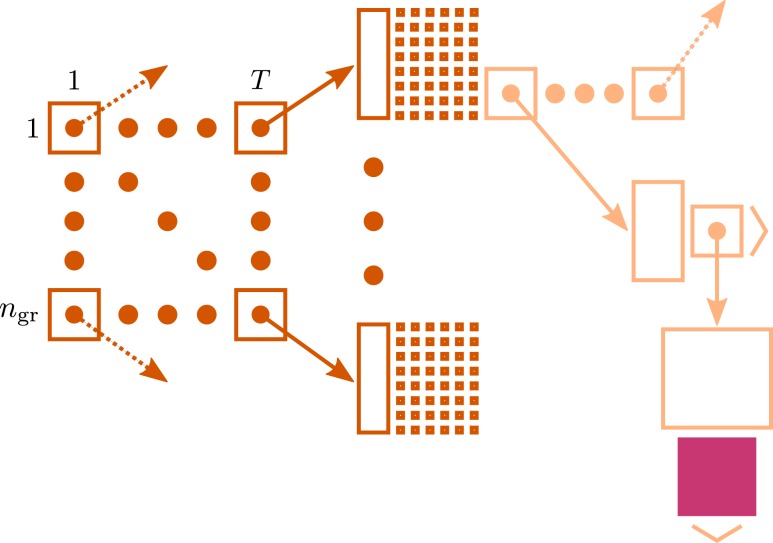
Figure 1.
Connection infrastructure in NEST optimized for supercomputers for the case that a simulation is run with T threads. The ngr × T matrix of dark orange squares illustrates the vector of length T which provides thread-specific access to sparse tables (Silverstein, 2005), where each sparse table maintains ngr sparse groups. Vertical dark orange rectangles and tiny squares indicate the per-group overhead of the sparse table. For simplicity, the figure shows only once the additional infrastructure which is required for each neuron with local connections (light orange). The filled pink square illustrates a locally stored connection object. Figure adapted from Kunkel et al. (2012b).

