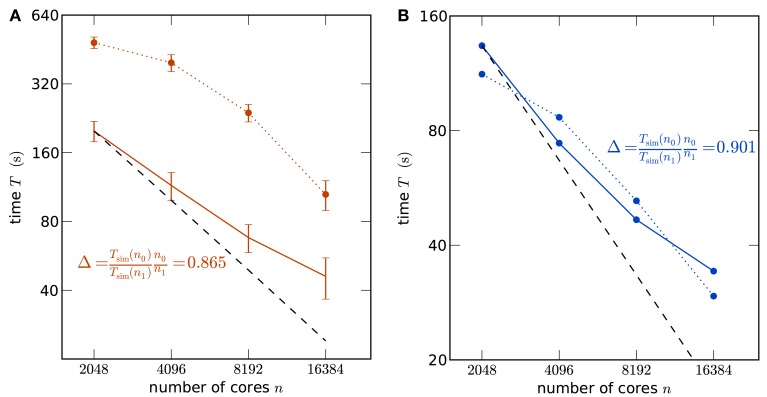
Figure 2.
Strong scaling of the NEST simulator. (A) A network of N = 3,502,080 neurons is simulated on K for 1 s of the biological system. Optimal linear scaling is shown by the dashed line. At 2048 cores the network consumes all available memory, causing the highest possible workload per core for the given network size. The scaling of the simulation time (solid curve) between 2048 and 4096 cores has a slope slightly below linear scaling (0.865). The error bars denote the standard error of the mean from 5 repetitions of identical simulations (same random numbers). The setup time (allocation and creation of neuron objects and synapses) is shown by the dotted curve. (B) Strong scaling for a network of N = 1,126,400 neurons on JUGENE. At 2048 cores the network consumes all available memory. Same symbol code used as in (A).

