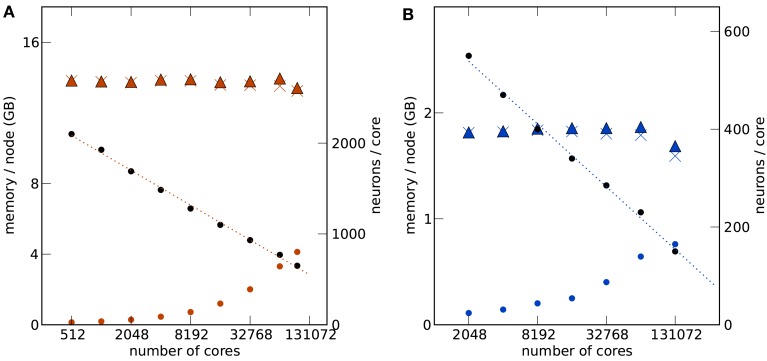
Figure 3.
Maximum filling scaling. The network size (number of neurons) is chosen so that the simulation consumes all available memory. The affordable number of neurons per core (black round symbols) decreases with increasing number of cores to keep the total memory consumption close to the usable maximum. The dotted lines give linear fits to the data. The memory consumption at different stages of the simulation (colored round symbols: after allocating the neurons, colored crosses: after establishing the synapses, colored triangles: after running the simulation) show the memory consumption at different stages of the simulation. The largest contribution is due to the synapses. All data are represented using log-linear axes. (A) K computer with 13.85 GB (nominal 16 GB) memory per compute node. (B) JUGENE computer with 1.84 GB (nominal 2 GB) memory per compute node. Note that the last point at 131,072 cores is slightly below the maximum memory usage, as the bisectioning method we used to empirically determine the largest possible number of neurons per core did not converge before the end of our access period to K.

