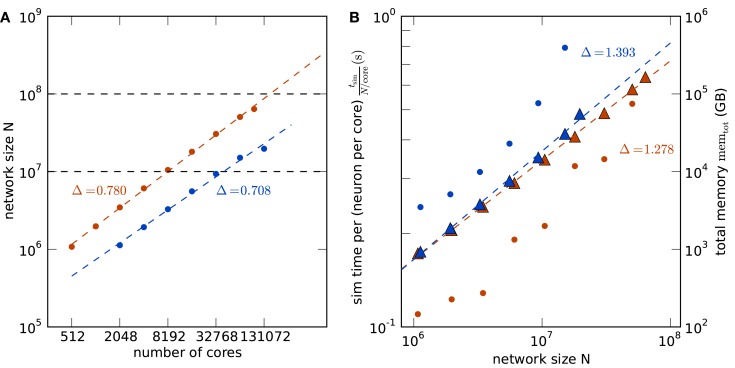
Figure 5.
Comparison of K (red) and JUGENE (blue). (A) Maximum possible network size as a function of the number of cores (same data as in Figures 4A,B). The dashed lines are determined by a linear fit to the data points. The lines end at the full size of the respective machine (294,912 cores for JUGENE, 705,024 cores for K). The dashed horizontal lines at 107 and 108 neurons are given for visual guidance. (B) Memory consumption and runtime. Simulation time normalized by the workload N/core (number of neurons simulated per core) of the processor as a function of the simulated network size (round symbols). Total memory consumption memtot as a function of the network size N (triangles). The dashed lines are linear fits to the data with slopes indicated by the symbols Δ.

