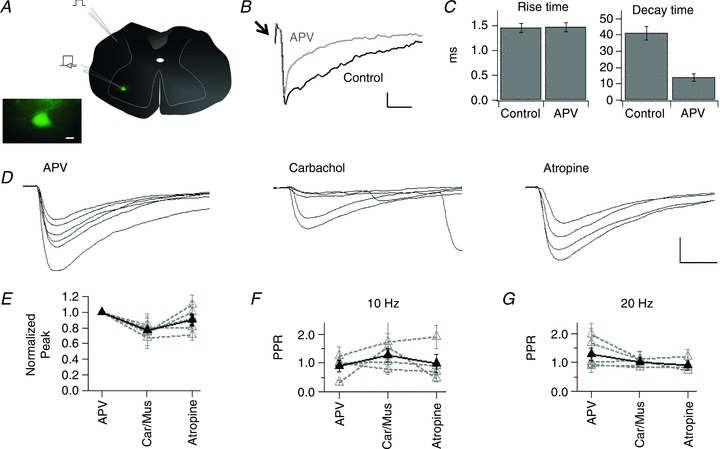
Figure 1. Muscarinic modulation of AMPA synaptic activity in spinal cord motoneurons.

A, schema representing the location of the stimulation electrode in the dorsolateral funiculus and the recording electrode in the ventral horn motoneurons. Inset, photomicrograph showing a large GFP+ neuron, located in the spinal cord ventral horn. B, traces showing evoked synaptic currents in control and after the addition of APV to the perfusion bath. Arrow indicates the stimulus artifact. C, mean ± SEM rise and decay time of EPSCs in control and in APV, for the cell in B. D, traces of evoked AMPA EPSCs from a motoneuron recorded in APV and after subsequent addition of carbachol and atropine. E, normalized average peak for AMPA responses in APV, after the addition of either carbachol or muscarine (Car/Mus) and after atropine. For this and the rest of the figures grey discontinuous traces represent the mean ± SEM for individual cells and the thick black line represents the group values. F, mean ± SEM PPR for cells recorded in the same experimental conditions described for E and stimulated at 10 Hz and for G at 20 Hz. Calibration bars: 10 μm in A (inset),10 pA and 20 ms in B, 200 pA and 5 ms in D.
