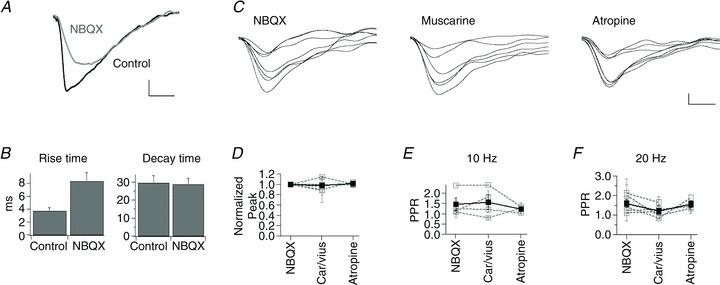
Figure 2. NMDA responses are not modulated by muscarinic activity.

A, traces of evoked synaptic activity recorded in control conditions and in NBQX. B, mean ± SEM rise and decay time of evoked synaptic activity for the cell in A in control and in NBQX. C, traces depicting NMDA-synaptic responses in NBQX and the consecutive addition of muscarine and atropine. D, mean ± SEM normalized peak values for cells recorded in NBQX, after the addition of either carbachol or muscarine (Car/Mus), and subsequent addition of atropine. E, mean ± SEM PPR in the conditions described in D for stimulation frequencies at 10 Hz and in F at 20 Hz. Calibration bars: 10 pA and 20 ms in A and 2 pA and 20 ms in C.
