
Figure 2. LTD of high-threshold primary afferent EPSCs in global CB1−/− and nociceptor-specific sns-CB1−/− mice.
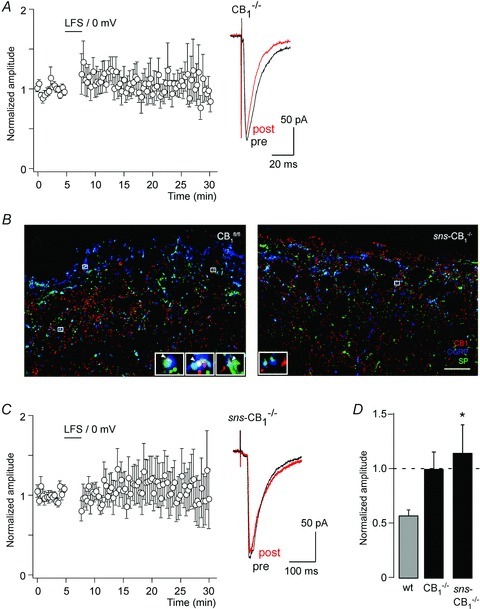
A, time course of EPSC amplitudes (normalised and averaged from 13 cells) following the paired conditioning stimulation protocol (same as protocol as in Fig. 1C) in slices obtained from global CB1−/− mice. Right, EPSC traces averaged from 10 consecutive stimulations (pre, black, preconditioning; post, red, 15 min after conditioning stimulation). B, confocal micrographs depicting CB1 (red), SP (green) and CGRP (blue) triple immunofluorescence staining in the superficial laminae of CB1fl/fl (left) and sns-CB1−/− (right) mouse spinal dorsal horns. Left, white arrowheads in enlarged boxed areas indicate co-localization of the three antigens, corresponding to CB1-containing nociceptive primary afferents in CB1fl/fl. Right, by contrast, only few SP+/CGRP+ puncta showed CB1 immunoreactivity in sns-CB1−/- samples (enlarged boxed area shows lack of CB1 immunoreactivity in SP+/CGRP+ boutons). Scale bar, 10 μm. C, same as A but in nociceptor-specific sns-CB1−/− mice (n= 13 cells). D, statistical analysis of A and C. *P < 0.05, sns-CB1−/− mice versus wild-type mice, F(2,43) = 4.23 (ANOVA, followed by Dunnett's post hoc test). Wild-type data shown for comparison in D are the same as shown in Fig. 1C.