
Figure 6. Synaptic plasticity in CB1−/− and sns-CB1−/− mice.
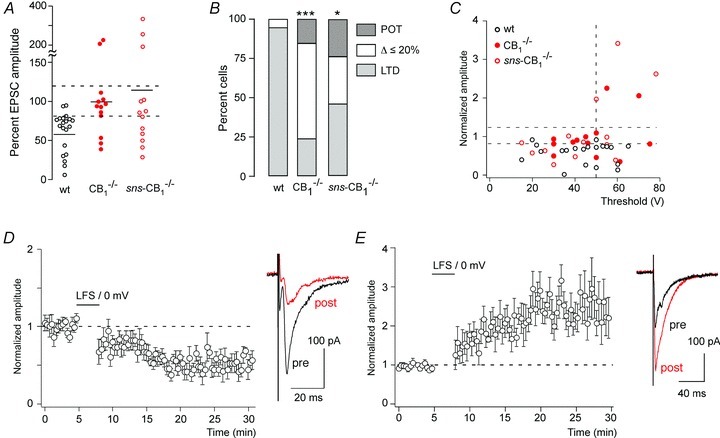
A, changes in EPSC amplitudes evoked by paired conditioning stimulation in CB1−/− (n= 13) and sns-CB1−/− mice (n= 13) compared with wild-type (CB1fl/fl) mice (n= 20). Same cells as shown in Fig. 3A and B (CB1−/− and sns-CB1−/− mice) and Fig. 2C (CB1fl/fl mice). Horizontal bars indicate average amplitude changes. Dashed lines designate the range, which was considered as no change (80%≤ΔEPSC amplitude ≤ 120%). B, portion of cells showing LTD, no change or potentiation (POT) in the three genotypes. *P≤ 0.05, ***P≤ 0.001. Pearson χ2(4,42) = 17.6 followed by pair-wise comparisons. The distribution of responses in sns-CB1−/− mice was not significantly different from that in CB1−/− mice (P= 0.28, χ2(2,24) = 2.53). C, post-conditioning EPSC amplitudes (normalised to pre-conditioning values) versus EPSC threshold in wild-type mice and in CB1−/− and sns-CB1−/− mice. D, time course of normalised EPSC amplitudes following the paired conditioning stimulation in the subset of CB1−/− and sns-CB1−/− mice (n= 9), which exhibited LTD. E, same as D but for cells exhibiting a potentiation by at least 90% (n= 5).