
Figure 7. Synaptic plasticity with NMDA receptor blocked.
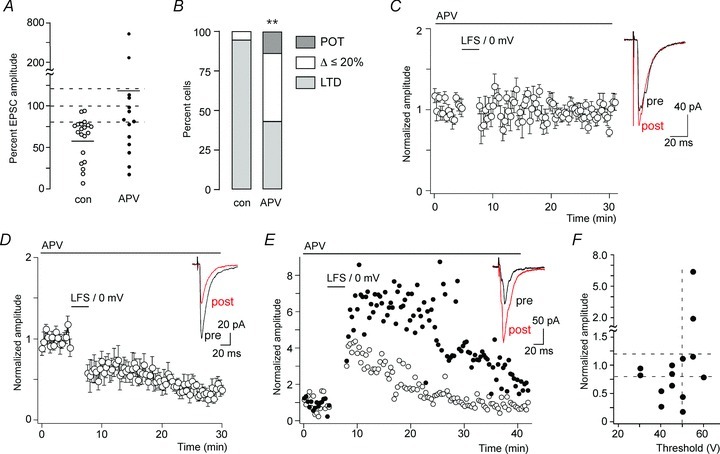
A, changes in EPSC amplitudes evoked by paired conditioning stimulation in the continuous presence of APV (50 μm) (n= 14 wild-type [CB1fl/fl] mice) compared with untreated slices (n= 20). Control cells are the same as those shown in Fig. 1C (CB1fl/fl mice). Horizontal bars indicate average amplitude changes. Dashed lines designate the range, which was considered as no change (80%≤ΔEPSC amplitude ≤ 120%). B, portion of cells showing LTD, no change or a potentiation by more than 20%. **P < 0.01. Pearson χ2(2,32) = 9.23. C–E, time course of normalised EPSC amplitudes in cells that responded to conditioning paired stimulation in the continuous presence of APV either with no change (n= 6) (C), LTD (n= 6) (D) or with a potentiation (n= 2) (E). Insets, averaged traces from 10 consecutively recorded EPSC immediately before (pre, black) and 15 min after (post, red) conditioning stimulation. F, averaged normalised EPSC amplitudes after paired conditioning stimulation plotted against EPSC thresholds.