
Figure 6. Topographical mapping of NTS neurons showing ASIC-like response to pH 7.0.
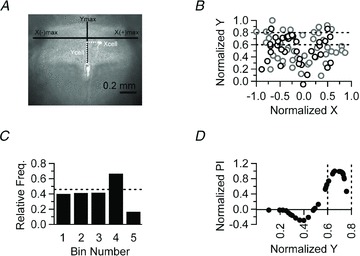
A, representative photomicrograph of a brainstem slice used to create a two dimensional, Cartesian representation of the NTS (see Methods). B, normalized positions of 86 NTS neurons from 37 brainstem slices acquired from 21 animals plotted in a Cartesian model of the NTS. Neurons that responded to pH 7.0 are plotted as black circles, whereas non-responders are plotted as grey circles. Dotted lines demarcate a region of the model NTS (bin 4 in C) which contains the highest percentage of responding neurons. C, the Y-axis was divided into 5 bins of 0.2 arbitrary units (normalized Y distance). The histogram depicts the relative frequency of cells that respond to pH 7.0 within each bin. The dotted line indicates the overall probability of finding a neuron that responds to pH 7.0. Neurons that respond to pH 7.0 are enriched in bin 4. D, the Y-axis location of responders (from B) is plotted against their normalized proximity index (see Methods). Note that a positive value indicates that a cell is, on average, closer to other responders. Dotted vertical lines denote bin 4 (as in B and C).