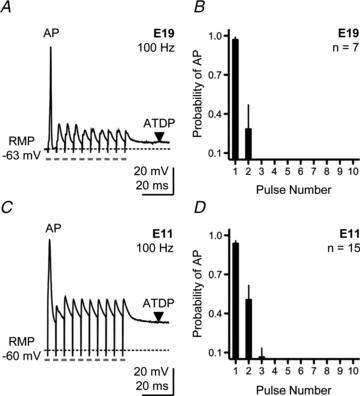
Figure 1. Single action potential generation in response to sustained synaptic activation in developing NL neurons.

A, representative current-clamp trace for an E19 NL neuron elicited by a train of 10 pulses delivered at a rate of 100 Hz. Pulse train repeated every 10 s. B, population data for E19 NL neurons showing the probability of action potential occurrence as a function of pulse number during a 100 Hz train. C, representative current-clamp trace for an E11 NL neuron elicited by a train of 10 pulses delivered at a rate of 100 Hz. Pulse train repeated every 10 s. D, population data for E11 NL neurons showing the probability of action potential occurrence as a function of pulse number during a 100 Hz train. In this and subsequent figures: RMP, resting membrane potential; AP, action potential; ATDP, after-train depolarizing potential, downward arrowhead. Dashed lines in traces represent baseline RMP. Grey rectangles under traces represent time point of stimulus pulse. Stimulus artifacts not removed. Data represent mean ± SEM.
